How one Northants farmer is using cost maps to cut crop risk
 © Tim Scrivener
 Mapping which parts of a field will lose money for a given crop is proving to be a valuable risk management tool for one Northants farmer, leading to better cropping decisions.
There are always parts of fields that underperform and some of these are obvious, such as the wet patch at the bottom of the hill or the headland along a wood.
However, the losses from these poor areas are often underestimated, dragging the whole field average down.
See also: Why wildflowers could cut aphid-spread viruses in potatoes
In addition, there could be other parts of fields that are also losing money that growers are unaware of, with costs of production of £200/t and beyond.
Challenge
Up to now, the challenge has been how to identify these areas and, more importantly, quantify the likely losses.
This is now possible with Hutchinsons’ Omnia tool, which allows farmers to easily analyse multiple years of yield maps and map the cost of production for specific crops and years.
Farm facts
Moat Farm, Whiston
- 700ha cropped area
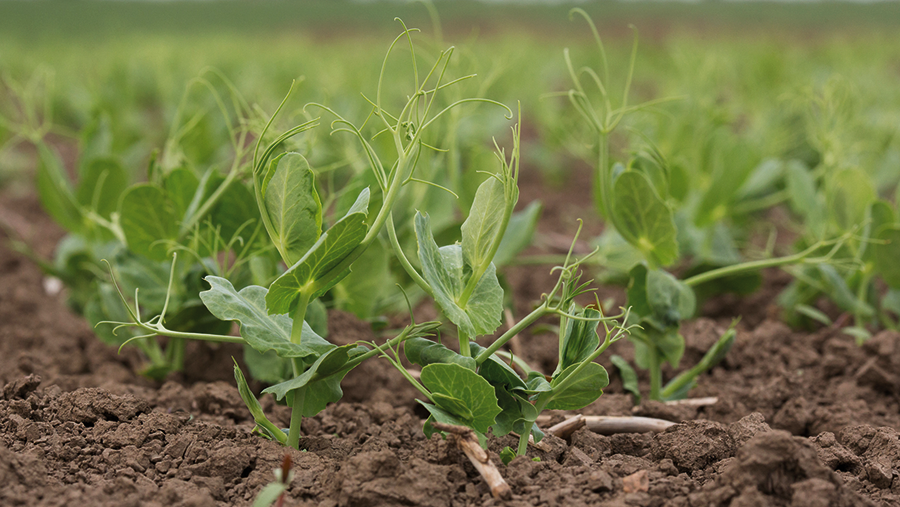
- First wheat (50% of area), winter and spring beans, second wheat, peas, spring barley and hybrid rye for seed
- Heavy Hanslope series chalky boulder clay
One farmer using this tool is Andrew Pitts, who has discovered how costs of production can vary massively within the same wheat field on his Northants farm, which is the first Hutchinsons’ Helix Technology Development Farm.
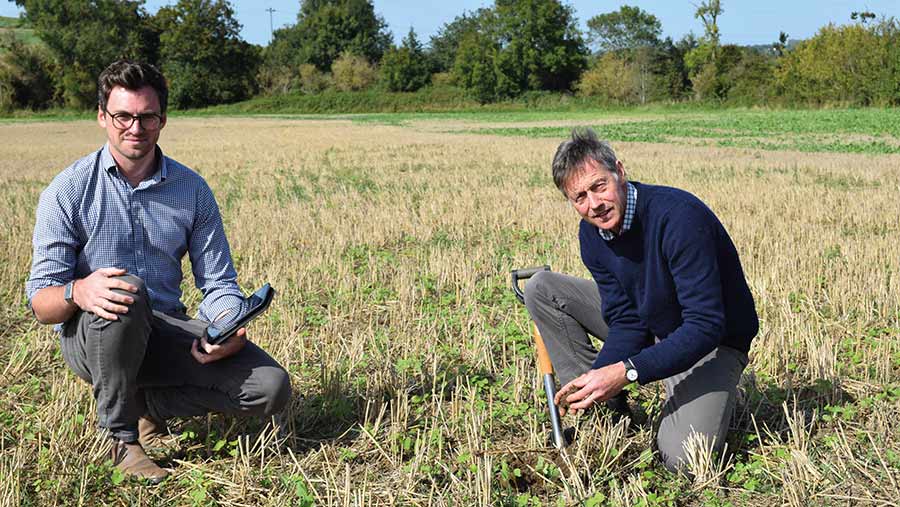
Michael and Andrew Pitts (right)) © Paul Spackman
Mr Pitts points to some headlands yielding 5t/ha and costing £200/t to grow while the best bits of the field yield 13-15t/ha, resulting in a production cost of £100/t.
He estimates about 10-15% of the cropped field is costing £180/t.
Armed with this information, farmers can then decide what to do with these underperforming areas.
Take action
Hutchinsons services leader Matt Ward says one option is to identify areas that consistently lose money over multiple years and remove them permanently from production. But it also has to be practical, adds Mr Ward.
If the low-performing area is in the middle of the field and the farmer is running a 36m sprayer, he won’t want to mess around so he will keep cropping this area.
However, it is not always about taking land permanently out of production, these maps can also be used as a tool for rotation planning.
“Some crops are more profitable than others, so farmers may persist cropping the whole field with a first wheat, but may not with a riskier second wheat or a break crop,” says Mr Ward.
His Hutchinsons agronomist Michael Shemilt points to Lockstump field at Moat farm for harvest 2021. The breakeven yield is 5.5t/ha for first wheat and 2.5t/ha for peas.
Looking at the poorer parts of the field, the tool is predicting a yield of 7t/ha for wheat and 2.5t/ha for peas.
Layers used to produce Andrew Pitt’s cost of production maps
- Combine yield data
- Variable seed rates
- Variable nitrogen
- Variable P, K and lime
- Variable rate fungicide (on two trial fields)
Therefore, if going with first wheat, the whole field would be cropped. But with peas, only part may be cropped.
For harvest 2021, the field is going into peas and a more detailed look suggests taking 3ha out will enable Mr Pitts to generate the same amount of money while spending £2,000 less on inputs.
“This enables Mr Pitts to spend this cash instead on cover crop mixes to help pollinators in the crop and help improve soil,” says Mr Shemilt.
Or if it goes into stewardship, he can get a payment for some of the areas.
Alternatively, Mr Ward says he can even stretch it for two years with second wheat followed by peas to take advantage of a two-year fallow option.
Effect of season
Mr Pitts also sees the tool as a way of managing risk as the crops are actually going into the ground.
Looking at his cropping mix, he sees first wheat and rye as his low-risk crops.
In contrast, pulses (peas and beans) are higher risk, along with second wheat, where establishment is key and there is the risk of a bad take-all year.
Making more of combine yield maps
Andrew Pitts is no stranger to yield maps and has been using them for 20 years, but admittedly in a much more limited way.
He has already concluded:
- Rabbits cost much more than first thought and he has invested in fencing to help protect affected areas.
- Pigeons are not as damaging in oilseed rape as previously thought.
- An unidentified lime issue was to blame for some poorer performing parts of fields, that previous soil testing had missed.
But it’s in the past two years that he has started layering data and mapping costs of production.
Matt Ward says the module for costs of production mapping uses standard figures and these can be edited to use the farm’s own data. The prediction becomes more accurate as the costs are known.
However, Mr Pitts says he already knows some figures at the start of the season, and knows the price paid for fertiliser.
“We can usually predict within £50/ha at the start of the season.”
There are also risks with spring barley with the market if oversupplied and dry spring weather.
“So if we are going to sell wheat at £150/t, which areas of the field do I crop to make money?” he says.
It’s down to weighing up the risk and reward of planting areas that cost more than £150/t to produce.
With first wheat, there is potential to increase yield and add value. But with second wheat, the risk is higher and it may prove that you shouldn’t crop those areas.
It may also be a case of adapting cropping choices as conditions change, as yield potential varies widely between seasons.
Learning from 2020
While harvest 2020 is one that many farmers will want to forget, learning the lessons could prove valuable in a similar season.
Andrew Pitts says looking back at data can help farmers make better decisions if they faced another extremely wet season. Especially as climate change means they are likely to happen more.
“It could show whether forcing the crop in is a waste of time. Or perhaps the best approach is to just plant the middle of fields.”
In his situation, Mr Pitts only got half his wheat in, as he stopped drilling in October.
“I’m pretty relieved that I didn’t keep going. Last year, the wheat averaged 11t/ha, but this year it averaged 7t/ha.”
Hutchinsons’ Matt Ward adds that by not drilling beyond the end of October, it didn’t impact the subsequent years’ yields by damaging soil structure.
“We didn’t want to damage the potential for harvest 2021,” says Mr Pitts. “We saw a lot of rutting in other fields in the local area where they persisted with drilling.”
For example, with peas, he may decide if seed-bed conditions are ideal, to drill the whole field.
But as spring approaches and if soils are drying too much as drilling day arrives, he may decide to scale back and not crop the more marginal areas.
Mr Pitts is already having to be much more flexible with his rotation because of increasing pest pressure and the more extreme seasons.
“Cropping is already more flexible than it was five years ago and it’s no longer set in stone until it’s in the ground.
“It’s no longer surprising to have crop failures with the weather and insect threats.”
In conclusion, he believes gross margin mapping is an important tool, as almost 5-10% of areas could be better off out of production. He believes many growers are missing out on the benefits.
“Data provides a discussion point for agronomists and growers to make better decisions together by looking at risk versus reward.”
Why is there increasing interest in cost of production maps?
There are several reasons behind the increased interest in mapping costs of production.
Matt Ward believes one is the loss of subsidies, which will hit farm incomes. There is also the introduction of the Environmental Land Management scheme.
Growers will be looking to identify areas that can be entered into the scheme to help plug the income gap.
In addition, there is the ongoing pressure on margins, especially after the challenging season.
These maps can help farmers tackle high-cost areas, perhaps improve or remove them from cropping.
There is also an increasing emphasis on growing riskier break crops and it can help mitigate some of the risk in growing these crops.