
Rainfall map highlights plight of farmers
The Met Office has published a rainfall map which highlights the extent of the dry conditions across parts of the country.
The map highlights that rainfall amounts across the UK this spring have varied widely from north and west to south and east.
The map shows rainfall figures for Spring across the UK as a percentage of the 1971-2000 long term average. All figures are provisional up to 25th May 2011.
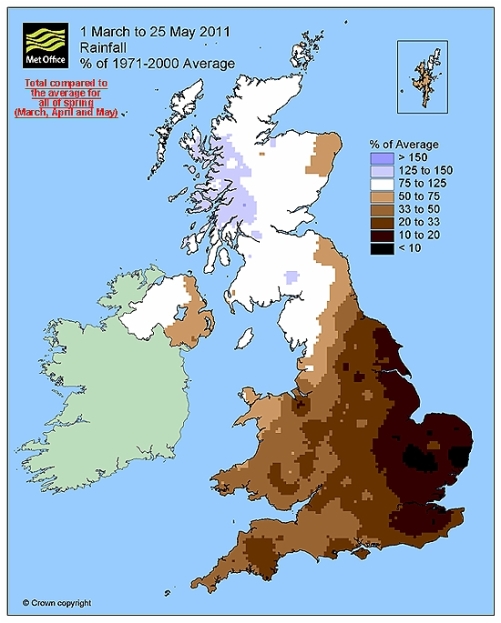
The driest region has been East Anglia, where rainfall amounts show that only 17mm of rain has fallen, just 13% of the long term spring average which is 134.9mm.
However, parts of north and west Scotland have had a wet season, with Argyll recording 538.6mm of rain, well above the long term average of 422.0mm.
For statistical purposes, the meteorological spring is the combined months of March, April and May and provisional figures are from 1 March to 25 May.
* In a bid to increase knowledge of the extent of the problem – and potentially share solutions to combating it – we want farmers to share their experiences of the dry weather. There are various ways you can let us know how the dry weather is affecting you – on our forums or by sending us pictures and video.