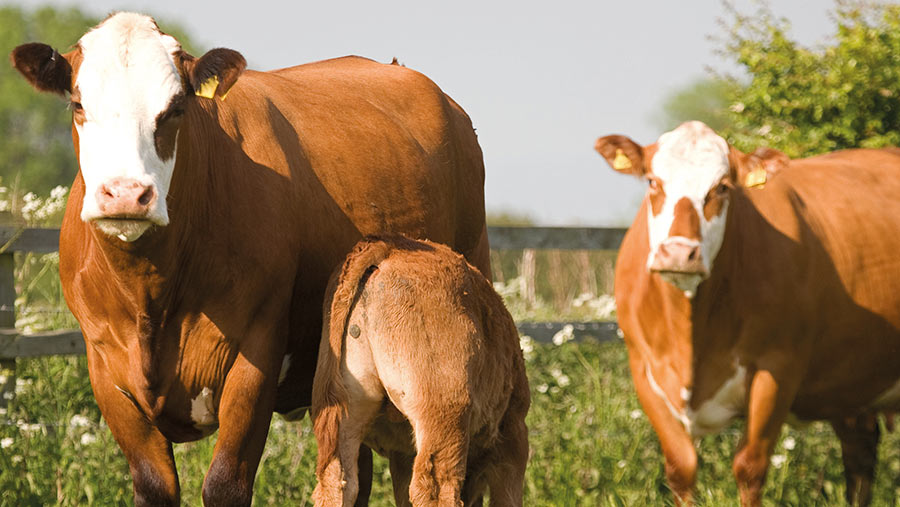
Calculating beef weaning efficiency and why it is important
 © Tim Scrivener
 Vets and consultants are urging suckler farmers to quantify how good their cows really are at rearing beef by looking at a calf’s 200-day weight as a percentage of cow weight at weaning.
Vet Kaz Strycharczyk of Black Sheep Farm Health believes tracking this key performance indicator (KPI) is a good way of understanding suckler cow efficiencies.
On most farms, an ideal target is for a cow to wean 50% of her weight, he says. Therefore, a 700kg cow should produce a 350kg calf at weaning.
See also: Advice on weaning and creep feeding suckled calves
However, this indicator varies hugely. Black Sheep Farm Health ran a competition with seven of its spring-calving suckler herds.
Herds varied in size from 30 to 200 cows but were mostly native breeds. Farmers were asked to weigh cows and calves at weaning.
Results showed:
- Average calf to cow ratio ranged from 41-63%
- Within herds, the best performing cows reared 57-101% of bodyweight
- The worst performing cows weaned 24-42%.
Think about cow size
Heavier cows don’t always produce the biggest calves and aren’t always the most efficient.
For example, two cows may each produce a calf that’s the same weight at 200 days. And, if one dam is heavier, she is costing more to feed and is less efficient than the lighter cow.
This will affect margin. However, the smaller cow is only more efficient if she calves easily, holds condition and gets back in calf.
Independent consultant David Hendy references one farm where cow size varied from 500kg to 870kg. The smallest cow produced a calf 33% heavier as a percentage of cow weight.
This would be impossible to establish without weighing cows and calves at weaning.
Calculating performance at weaning can help you:
- Decide the right size of cow for your individual farm
- Establish the optimum weight or breeding for the farm
- Improve herd uniformity to help with feed efficiency and create an even batch of calves.
Below, Mr Hendy sets out how to calculate your herd’s efficiency and Mr Strycharczyk explains why this is important and what you should do with the results.
How to calculate a calf’s 200-day weight as a percentage of cow weight
Weigh all cows and heifers with their calves at weaning using the following calculations:
1. Work out your 200-day baseline average weaning weights
As calves may be different ages at weaning, this removes any variability and makes the figures comparable year-on-year.
(Average weaned calf weight ÷ average age in days at weaning) x 200 days = 200-day baseline average weaning weight
For example: (350kg ÷ 240 days) x 200 days = 292kg
2. Calculate the percentage sum of barren cows and dead calves (calf mortality from birth until weaning)
Percentage of barren cows + percentage of calf mortality = X%
For example: 5% + 5% = 10%
Take that number from 100% to get a figure for the percentage of in-calf cows and live calves
For example: 100% – 10% = 90%
3. Calculate the 200-day true average weights of calves
200-day baseline average weaning weight x percentage of in-calf cows and live calves = Xkg
For example: 292kg x 90% = 262.8kg
4. Work out herd’s average 200-day calf weight as a ratio of cow weight
(200-day average weight of all calves ÷ average weight of all cows) x 100 = X%
For example: (262.8kg ÷ 650kg ) x 100 = 40.4%
How to use the figures
The key is to collect data for your farm and compare it year-on-year with a view to improving.
A weaning percentage of 40% should be a minimum target. If your herd is under this:
- Look at individual cows producing below average and ask why. Is it age, breed, or bull, for example? Can this be used to inform culling policy?
- Can fertility be improved? Target weaning 95 calves for every 100 cows put to the bull.
- Are the calves suffering from a worm burden or disease challenge?
- Look at above-average cows and use this as part of your selection criteria for breeding replacements.
Key considerations
The KPI is only one factor influencing breeding decisions and should not be looked at in isolation. Attributes such as good feet, udders and temperament are key.
“On this measure, what you’re looking for is a cow consistently rearing a calf heavier than the average while not going lame, getting in calf, and with a good temperament,” says Mr Strycharczyk.
It’s also important to consider:
- Was it a good year for grass growth? Were cows in particularly good condition?
- Did you creep-feed? If you fed creep one year and not the next, the figures won’t be directly comparable, but the data could be used to highlight the benefits of creep on calf weight to cow weight ratio.
- If you have variable breeds, which performed best on your system?
Case study: Dan Burling, Chain Farm, Over, Cambridgeshire

Dan Burling © Terry Burling//
Farm Facts: Chain Farm, Over, Cambridgeshire
- Farmed by Dan Burling, his brother, Stuart, and father, Brian
- 500ha (1,236 acres) grazeable area for cattle – rough, low-input RSPB ground
- 500ha of arable – mostly milling wheat
- 280 spring-calving Stabiliser cows
- 60% of heifers kept as replacements. Most of the rest sold for breeding
- Most males finished as bulls and sold deadweight to Woodheads or Dunbia
- Bull finishing weights of 370-380kg deadweight at 12-13 months, grading R4L (mostly low Us)
For Dan Burling, who farms with his brother, Stuart, and father, Brian, understanding calf weight as a percentage of cow weight helped confirm that breeding a smaller, more uniform herd was the correct path.
The suckler herd was mainly large, Salers-cross cows put to a continental bull to produce a big carcass calf. Calving issues were an ongoing problem.
After using a Stabiliser bull on some of the cows, Mr Burling realised that the smaller females brought big benefits: calving ease and calf vigour improved and more cows could be carried on the same area of land.
The Stabiliser-cross calves also finished quicker. As a result, the decision was made to move to a Stabiliser herd.
Keen to make informed decisions based on data, he joined AHDB Beef & Lamb’s Progressive Beef Group and began benchmarking various parameters, including calf weight as a percentage of cow weight.
The figures showed that the continental-cross cows weighing 800kg weaned 40% of their bodyweight, on average, compared to about 50-52% for smaller, Stabiliser-type cows of about 650kg.
“It highlighted that the right thing to do was to have a smaller cow,” Mr Burling recalls.
Prior to making breed changes, average cow size was higher and there was variability between cows.
This meant cows often had to be split and fed according to size and weight. .Now, cows average about 650kg and the herd is more even, which has helped feed efficiencies.
Mr Burling stresses that because of its relatively low heritability, farmers should not look at weaning weight as a ratio of cow weight in isolation or put too much emphasis on it.
Correcting all figures to a 200-day weight is also important to allow fair decision-making. Body condition score should also be noted at the same time as weighing.
