
Variable production margins highlight importance of SFI
 © GNP
© GNP Typical farm types in England face a lean financial future unless they adopt Sustainable Farming Incentive (SFI) options or find sources of income from other environmental measures or alternative enterprises.
Budgets for combinable cropping and mixed farming models highlight the importance of SFI, with dairy also benefiting, though to a lesser degree.
Farm business consultant Andersons’ latest budgets demonstrate the volatility of margins from production from year to year.
See also: Farm cash flow advice as pressure mounts
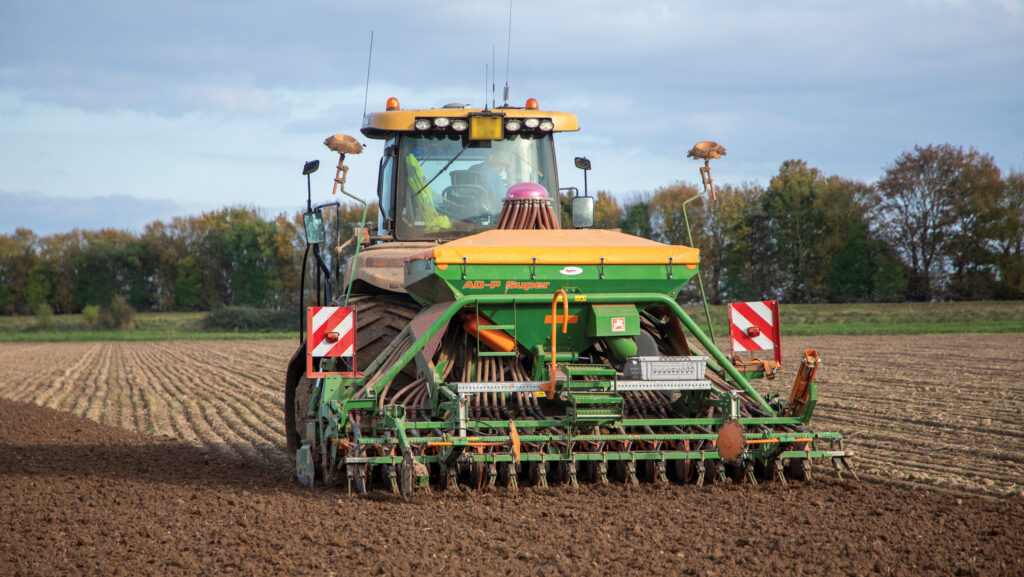
They show its 600ha Loam Farm model’s estimated profit from the 2024 harvest at £202/ha, with £93 of that coming from BPS and £95 from the SFI.
Without that support, the margin from production after costs, including drawings, rent and finance, is just £15/ha. This is on a farm that managed to establish and harvest its winter crops, although the resulting yields were down by 7-10% on the farm’s average.
The model budgets assume that BPS payments will fall in roughly equal steps over the next three years, with inflation continuing to reduce the real value of this income.
However, it is possible that the government could choose, for cashflow purposes, to make the main cut next year.
Defra has a target of 70% uptake for SFI. The 2023 offer has resulted in about 23,000 agreements and those for the 2024 offer are progressing, although more slowly than many would like.
“While there’s no compulsion, we’re telling clients to give SFI a really good look,” says Richard King, head of business research at Andersons. “There is something for almost everybody, including measures that do not impact farming productivity.”
While the model budgets show a lower SFI contribution on dairy farms, possibilities do exist, he says, which was generally not the case with Countryside Stewardship.
He also points out that careful budgeting is needed to account for the cost of delivering SFI options, whatever the farm type.
© Tim Scrivener
Dairy model
The firm’s Friesian Farm model is based on a holding with 220 year-round calving cows and their followers on 130ha, part of which is rented.
Margins for 2024-25 (ending 31 March) and 2025-26 are more positive, although BPS and SFI account for almost half of the profit in 2024-25, again indicating the need for all farm types to consider what SFI offers.
The resulting business surplus after direct support is more than 6p/litre in both years, which will afford some farms the cash needed for essential infrastructure reinvestment. The requirement for this was put at 2.4p/litre a year for the next 10 years by a recent Kite Consulting report.
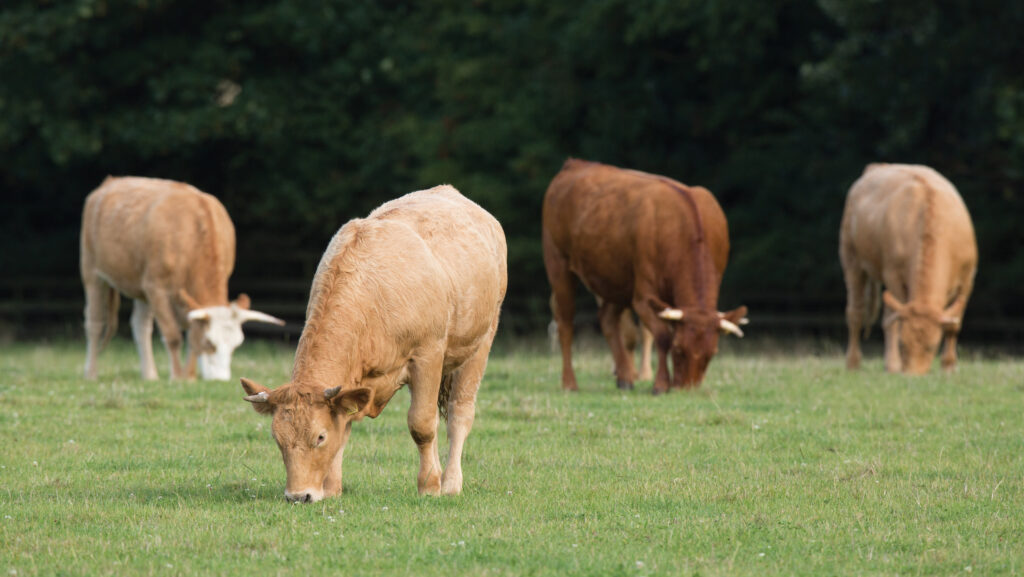
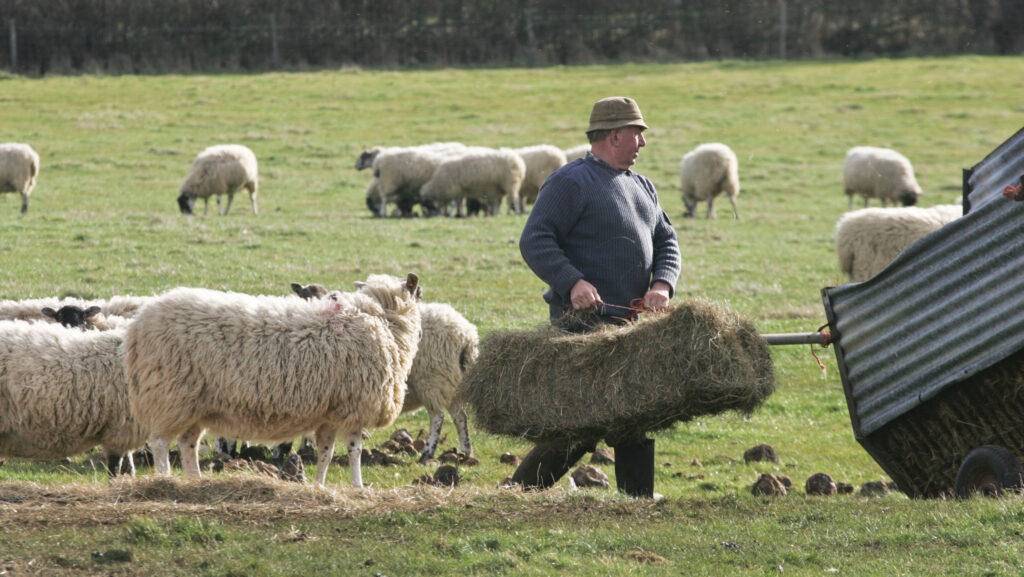
Beef and sheep
The Meadow Farm model is a notional beef and sheep holding.
Wheat and barley are grown, mainly to feed on-farm. It has 60 spring-calving suckler cows, finishing all progeny, a dairy bull beef enterprise and 500 ewes.
Despite strong beef and sheep prices, this farm makes a loss before direct support, with the potential for SFI to contribute significant amounts to this type of business, along with Countryside Stewardship.
While the projected loss from production is smaller in the current year, it rises in 2025-26, as beef and sheep prices are expected to settle from their current levels.
© Tim Scrivener
Farm borrowing
Andersons expects the bank base rate to settle at about 3.5% in the medium term, after a series of cuts over the next three years.
The Bank of England’s most recent figures show the total amount outstanding in lending to farming and forestry businesses at £17.698bn.
This is a drop of £273m compared with the same month in 2023. In both years, farmers were using about 86% of the facilities available to them.
Climate measures
The variability of farm performance from year to year is clear to see from the model farm budgets. Added to this it is notable how the variation of performance within sectors is greater than that between sectors, says Richard. The impact of climate variations is adding to those of the market.
This means that alongside the usual plant and farm infrastructure investment requirements, farmers will need to put in measures to help with climate resilience.
UK farming profitability
Defra measures the aggregate profit of UK farming through its annual Total Income from Farming (Tiff) analysis. This is the return to all farming business owners for their management, inputs, labour and capital invested. Its first estimate for Tiff 2023 was put at £7.2bn, a drop of £800m (-9.8%) on 2022’s record figure.
Tiff is often revised later in the year. Andersons expects this to be the case for the 2023 figure, which it thinks likely to be reduced.
The 2024 and 2025 Tiff estimates in the chart are made by Andersons, with 2024 falling to about £6bn, mainly because of lower arable output.
Land use in England
The area of land in use for agriculture was down 1% year on year in June.
Defra’s annual census shows the total area used for agriculture at 8.7m ha, accounting for 67% of the total area of the country. The croppable area is 57% of the land in use for agriculture while permanent pasture accounts for 38%.
Notable detail included:
- 6.7% drop in arable crop area, to 3.5m ha
- 107% rise in uncropped arable land to 581,000ha. Within this, 276,000ha was bare fallow, with the remainder in environmental uses
- 11% fall in wheat area to 1.4m ha
- 6.2% rise in barley area to 849,000ha
- 26% fall in oilseed crop area to 274,000, with 91% of the total area accounted for by oilseed rape
- 1.2% rise in potato area to 83,000ha
- 3.2% fall in horticultural crop land area, to 113,000ha
- Solar panels covered 7,300ha, with a roughly even split between ground where there is some agricultural production and that where there is none.
Loam Farm – arable |
||||
|
600ha combinable crops; 240ha owned, 360 FBTs. Owner and one full-time worker plus harvest casual |
||||
|
£/ha |
2022 actual |
2023 estimated |
2024 estimated |
2025 budget |
|
Output |
2,136 |
1,716 |
1,515 |
1,607 |
|
Variable costs |
460 |
754 |
547 |
542 |
|
Gross margin |
1,676 |
962 |
968 |
1,065 |
|
Overheads |
507 |
545 |
601 |
653 |
|
Rent and finance |
243 |
256 |
266 |
266 |
|
Drawings |
80 |
82 |
86 |
89 |
|
Margin from production |
847 |
79 |
15 |
56 |
|
Basic payment (+SFI*) |
163 |
128+40 |
93+95 |
58+95 |
|
Business surplus |
1,009 |
246 |
202 |
209 |
|
Source: Andersons. Note: SFI payment is shown gross – compliance costs are included in farming costs |
||||
Meadow Farm – Beef, sheep and arable |
||||
|
154ha lowland farm (114ha owned, 40ha FBT). Beef suckler cows plus finishers, finished bulls, sheep and arable. Owner, one full-time employee and casual |
||||
|
£/ha |
2022-23 actual |
2023-24 estimated |
2024-25 estimated |
2025-26 budget |
|
Output |
1,619 |
1,623 |
1,732 |
1,638 |
|
Variable costs |
871 |
707 |
771 |
699 |
|
Gross margin |
748 |
916 |
961 |
939 |
|
Overheads |
631 |
641 |
653 |
672 |
|
Rent and finance |
325 |
337 |
343 |
342 |
|
Margin from production |
(208) |
(62) |
(34) |
(76) |
|
Basic payment (+SFI*) |
184+22 |
150+22 |
114+184 |
80+178 |
|
Business surplus (deficit) |
(2) |
110 |
264 |
182 |
|
Source: Andersons. Note: SFI payment is shown gross – compliance costs are included in farming costs |
||||