
Snapshot of the UK’s food and farming sector

Latest data gives an insight into the UK’s agri-food sector – from imports and exports, to food prices and consumer spending.
The Food Statistics Pocketbook, produced by Defra and the National Office of Statistics, looks at how the sector has changed in recent years.
Overview of the sector
The UK’s agri-food sector contributed £96.9bn or 7.1% to national gross value added in 2012.
The food sector, including agriculture, employed 3.6 million people in Great Britain in the first quarter of 2014, accounting for 13% of all people employed.
Agriculture and fishing employed 12% of Briton’s workforce in this period – that’s 420,000 people.
How self-sufficient are we?
The UK exported £18.9bn worth of food and drink in 2013, £6bn more than in 2005 (measured in 2013 prices). Imports of food and drink were much higher than exports at £40.2bn in 2013.
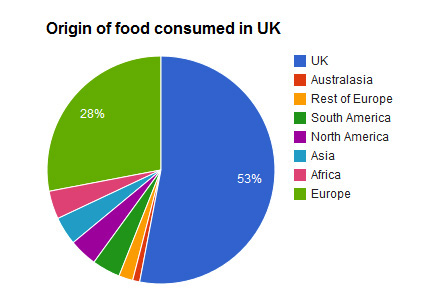
Twenty-three countries accounted for 90% of the UK’s food imports in 2012, with UK produce accounting for 53% of that.
The EU as a whole had a food production-to-supply ratio of about 90% in 2013. This is the farmgate value of raw food divided by the value of raw food for human consumption.
The leading foreign suppliers to the UK were the Netherlands (5.8%), Spain (5.3%), France (3.5%), Germany (3.3%) and Ireland (3.0%).
How UK food prices compare to the EU
Food prices rose 37% in the UK between January 2007 and July 2014 – well above the EU average price rise of 21% over the same time period.
In Germany however, food prices increased 19% in that time and in France they rose 13%.
Some food types were cheaper in the UK however. Bread and cereals were the cheapest comparison overall, with prices about 16% higher in France and Germany than the UK.
How consumer spending and prices have changed
Consumer expenditure on food has continued to rise despite the economic downturn. UK consumers spent £196bn on food, drink and catering in 2013 – a rise of 4% on 2012.
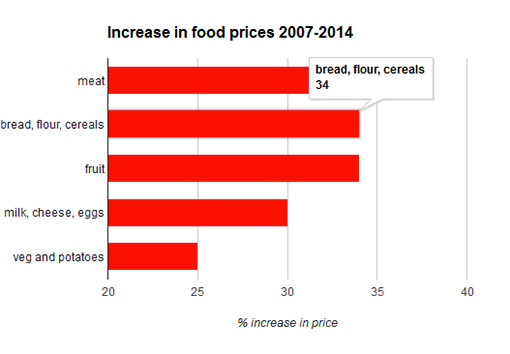
Spending on food shopping has increased 30% since 2007 (before the recession) and food prices have risen 18% in real terms in that time. This followed a long period of falling prices.
Gradual price reductions since early 2013 to June 2014 have reduced that real-term increase to 8.6% compared with 2007.
How much we spend on food per household
The average UK household spent 11.6% of its income on food in 2012 – 1.1% more than in 2007.
The poorest households were the worst hit by the economic downturn and increase in food prices, with the poorest 20% spending 16.6% of their household income on food.
Food is the largest item of household expenditure for low-income households after housing, fuel and power costs.