How new technology enables yield mapping for root crops
 © A Farrell Contracting
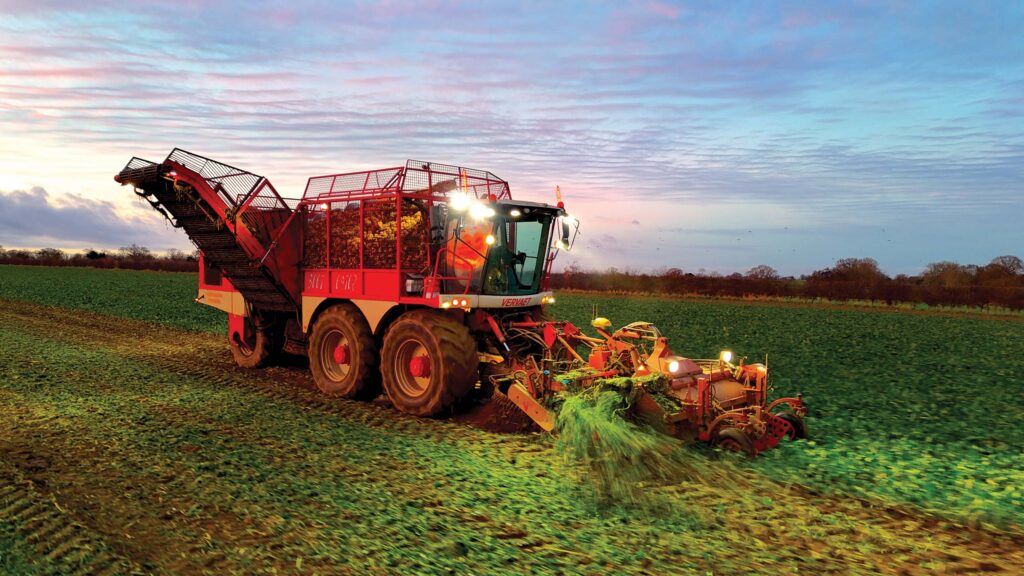
 In-field yield mapping of root crops, such as sugar beet and potatoes, is tricky compared with grain crops, not least because of the added complication of soil attached to the roots or tubers.
While that challenge hasn’t been completely overcome, machinery dealer Ben Burgess is now providing a yield mapping system that can be retrofitted to both sugar beet and potato harvesters.
See also: How soil testing can tackle sugar beet cyst nematode
Carl Pitelen, group innovations manager for precision technologies at Ben Burgess was challenged by a customer to provide in-field yield mapping to evaluate potato variety performance and the impact of soil type on yield.
He came across Canadian company Greentronics, which had a system it had used across North America for some time.
The Ben Burgess offer combines the hardware from Greentronics with John Deere components.
The new hardware costs about £9,000 to fit, or up to £15,000 if none of the John Deere system is already fitted.
Carl explains: “Three John Deere components are needed: a GPS signal, provided by John Deere StarFire, a John Deere GreenStar display to record and document everything.
“Once the data is recorded, the John Deere telematics JD Link controller connects the data to the John Deere Operations platform.
“That transfers the data backwards and forwards from the field to the cloud and allows growers to view the yield maps.”
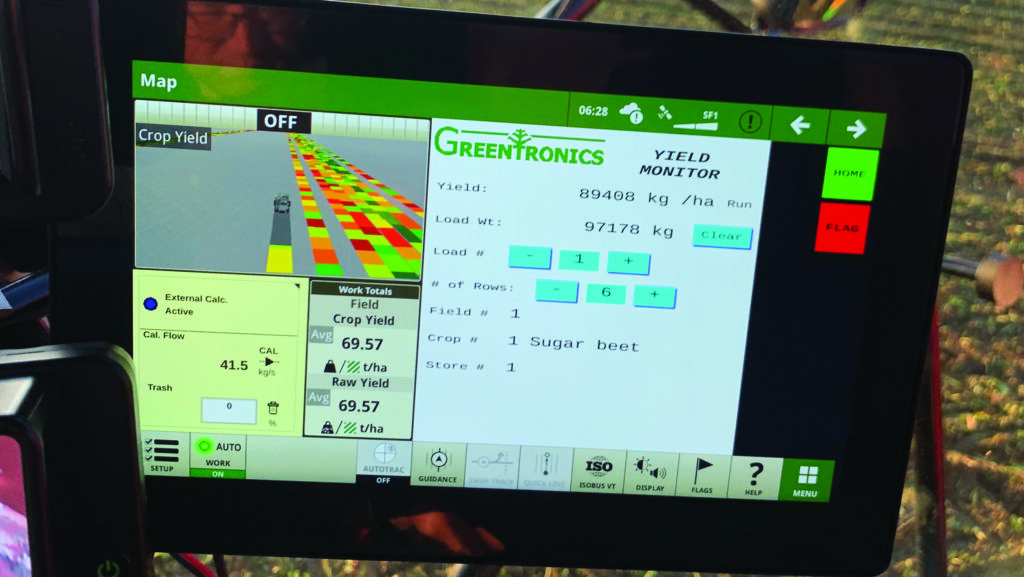
The John Deere GreenStar display records and documents the yield data © Ben Burgess
The Greentronics hardware consists of two weigh cells and a speed or flow sensor, with the data transferred back to the GreenStar display.
“The two weigh cells are mounted on the ring trace or, on a potato harvester, the bunker elevator to measure the weight of the crop flow over the rollers.”
Logistically, the biggest challenge is making sure there is enough conveyor belt space for a smooth flow of beet or potatoes to be recorded before the crop goes into the tank.
“On some machines there isn’t much room between the beet coming off the turbines and turning the corner to go into the tank,” says Carl.
“If the beet are bouncing as they hit the load cells, accuracy will be compromised.”
Weigh cells are tared at the beginning of each day, he says. “There’s functionality within the system to run the harvester empty to zero the ring trace.”
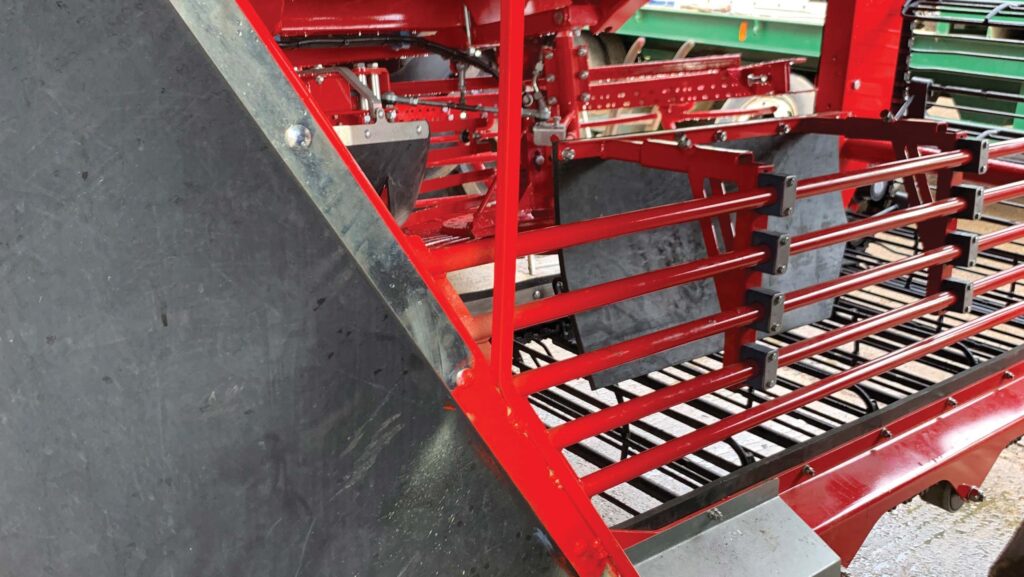
Weigh cells are fitted to the ring trace on the beet harvester © Ben Burgess
Dirt tare challenge
It’s also possible to correct for an estimated dirt tare, either manually during harvesting or retrospectively once sugar beet factory information is available.
What is harder to correct is different levels of soil clinging to beet or potatoes across the field, Carl admits.
“The yield won’t be that far out across the board, but that is a variation you have to accept as a potential inaccuracy.”
Four sugar beet harvesters – three Vervaets and one Grimme – have been fitted with the system this season.
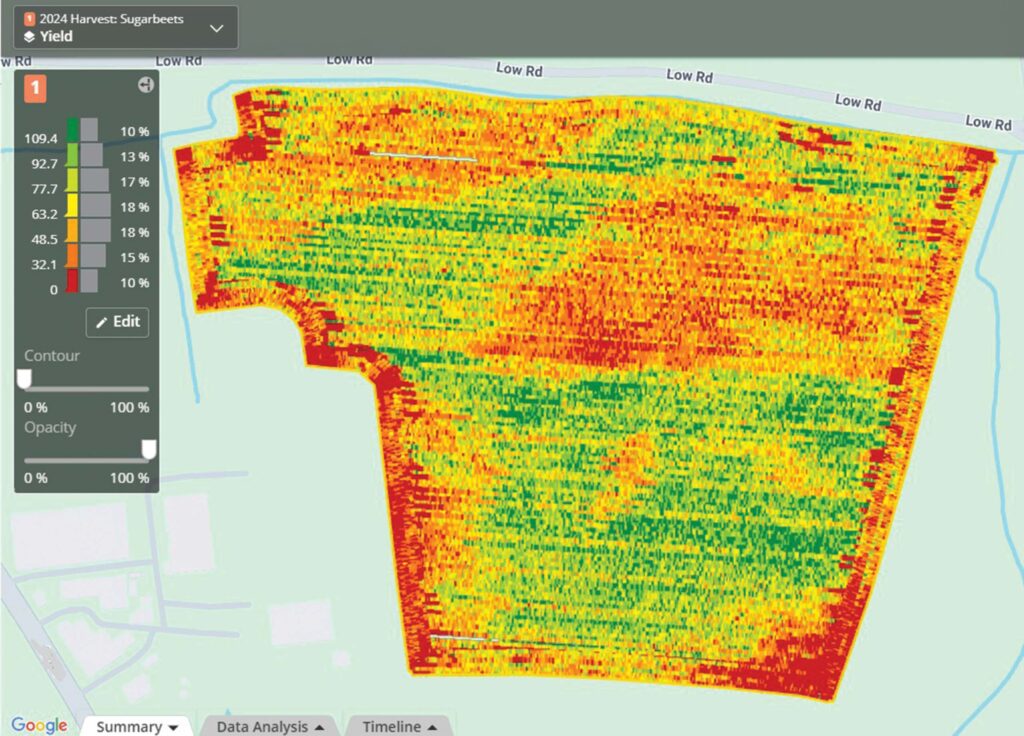
A sugar beet yield map showing differences across a field owned by the Ben Burgess group, which averaged 77t/ha © Ben Burgess
Accuracy
Accuracy in some fields has been compared with trailer loads over a weighbridge. Typically, yield mapping has about a 5% inaccuracy compared with the total field yield, Carl says.
“It’s early days, and we’re still learning how to make it more accurate, using more calibrations, improving flow consistency.”
Already, though, the maps are providing value both for British Sugar and for the grower.
British Sugar has been trialling sharing real-time information from harvesters with hauliers within the beet supply chain this season, to improve logistics.
Harvesters with the weigh cells fitted automatically capture the basic harvest records – broad estimates of tonnage and clamp location that inform the haulier in real-time.
This minimises the need for the harvester to provide that information and helping to align factory speeds with expected beet deliveries.
Field variation
From a grower perspective, the yield maps help compare good and poorer areas of fields.
For example, on a field owned by the Ben Burgess group, Carl shows a yield map with a clear yield difference between one part of the field and the rest.
“The average yield across the field was 77t/ha, which as an average is not bad.
“But what happened in this area? Did we not get the primary cultivations right in that part? Is it soil type? Was it something to do with drilling? Is it soil pH and it needs more lime?
“Was it waterlogged and we need to address drainage, or is there a compaction issue?
“It starts to give insights that you wouldn’t get from the whole-field average,” he says.
On another field, Carl says the yield difference follows a soil type difference across the field.
“You can learn from this data. For example, where yields are higher there will be higher offtakes of nutrients, like potassium, which you could then use to create a variable rate application map to put those nutrients back.”
Making the data easily available to analyse and use within the My John Deere Operations Centre is key to helping unlock the value, Carl suggests.
“Growers want their data in one safe, easy-to-operate platform.
“A lot of the efficiency gains in farming have been made with big machinery and higher outputs, but as margins continue to be squeezed, there’s value in data that improves attention to detail and understanding what’s happening in the field,” he says.
Case Study: Morley Farms, Norfolk
While yield mapping of this year’s 100ha sugar beet harvest has happened by default for David Jones at Morley Farms, near Wymondham in Norfolk, it was something that he had considered in the past.
“It’s happened by default because the contractor has the kit fitted on both his harvesters,” he explains.
“But the same as with yield mapping on the combine, it gives an insight into the good and bad bits on a field.”
With a harvesting width of just 3m compared with 9m or wider on a combine, resolution on beet is better.
Although David recognised the need to be cautious with absolute values, given the difficulty of calibrating dirt tares correctly.
“I’m more interested in relative yields,” he notes.
Relative values help address why certain parts of field perform well or badly. “Is it soil type or compaction? It could be slope, shading from trees or any number of historical things,” he says.
“But it helps you decide about which crops to grow, or whether to put wildflowers or other wildlife option in part of a field.”
Early analysis of this year’s fields hasn’t necessarily brought any major surprises.
“It’s as you would expect – the middle of the field has good yields, while the bits around the outside or under trees are not as good.”
He plans to use the data to think about whether he can do something differently, he says.
“It could be we could drill the field the opposite way to change where the turning headlands are.
“We did that in a field – not sugar beet – where yield maps showed lower yields and the headland always had lots of traffic, and then when you cultivated, it would stand with water.
“So we did a 48m double headland and turned on the inner headland to give the outer 24m a rest from traffic, and that’s transformed the field – we don’t get standing water, so it is possible to make a difference,” David says.
Another crop’s yield monitoring data will also potentially be valuable for the farm’s research trials network, which includes the British Beet Research Organisation, Niab and the AHDB.
“Yield mapping data has been invaluable for Niab to help calculate lots of thing, including nitrogen use efficiency,” he says. “So I think this is a step forward.”