
How do three main farm carbon calculators compare?
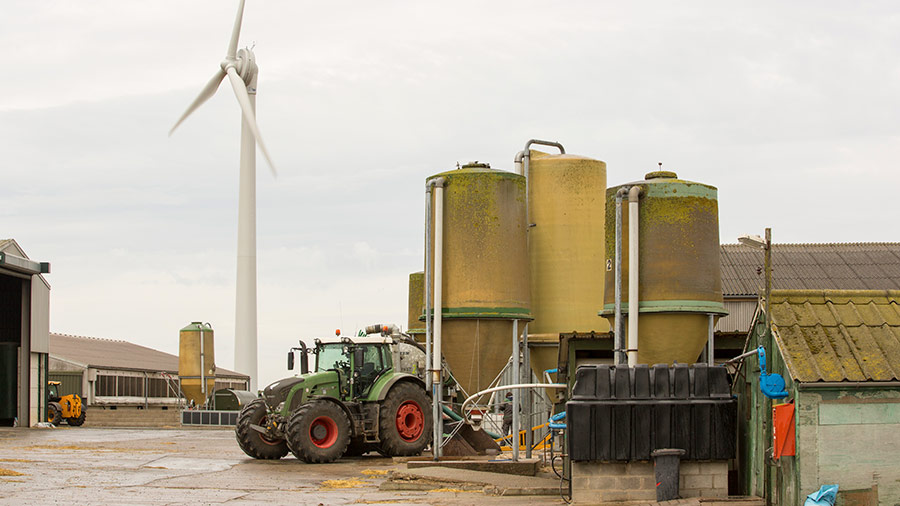 © Ashley Cooper/Science Photo Library
 Want to know how much your farm is contributing to industry net-zero targets and how to improve? Or are you looking to access carbon trading markets or other financial incentives for lower-carbon farming? The chances are you will start by using a carbon footprint calculator.
Even if you don’t want to understand whether you’re net-zero or access some form of financial or marketing incentive, carbon accounting will make sense for many farm businesses to consider simply because managing carbon effectively on farm is likely to positively affect the farm’s productivity and bottom line.
See also: Why carbon reduction goal makes good business sense
Which calculators are assessed?
Our farmer testers looked at three popular whole-farm calculators, all of which cover arable and livestock enterprises and are “self-service” options that can be used without input from a farm adviser.:
- Farm Carbon Toolkit
- Agrecalc
- Cool Farm Tool
The calculators express carbon footprints as tonnes of carbon dioxide equivalent (CO2e), and give a breakdown of emissions by source. Some also include greenhouse gas type.
The Cool Farm Tool calculates the footprint by product (such as crop or livestock type), while the Farm Carbon Calculator uses a whole-farm basis. Both of these calculators are able to show live results as data is entered.
Agrecalc provides whole-farm, product and enterprise breakdowns. Whole-farm calculations have the advantage of highlighting the big picture, but can make attributing emissions to different enterprises on the farm more tricky, or using averages across the farm rather than an individual field or product level.
Product-related calculations make it easy to compare emissions by product, but it can mean the big picture is missing and potentially require multiple calculations for a whole-farm assessment. Averages might still need to be used across an enterprise or product type.
The reviewers
- Richard Findlay, Westerdale, North Yorkshire – NFU Livestock board chairman
- David Lord, Clacton, Essex – part of the Nature Friendly Farming Network steering group
Livestock-focused option
One popular tool not included in our comparison is Alltech’s E-CO2. It differs from the other calculators in that it is aimed at dairy, beef, lamb, poultry and pig farmers, and is built around a Carbon Trust-accredited Environmental Assessment, which involves a farm visit.
This lasts two to three hours and reviews all areas of the farm, with a comprehensive report following within five days, making it more of a consultancy approach rather than self-assessment.
A full farmer self-entry system is due in October, alongside a feed module that will help farmers understand the effects of changing feed ingredients on their carbon footprint.
What types of data do the calculators typically ask for?
- Livestock age and numbers
- Annual fuel type and quantity
- Utilities type and quantity
- Assets (buildings, machinery and materials)
- Crop yields
- Fertilisers (chemical and organic)
- Land area and type
- Agrochemicals
- Imported livestock feed
- Waste and disposal method
- Distribution and refrigeration
- Soil organic matter
- Perennial biomass features
Source: Savills
Where do you typically find the data?
- BPS or stewardship records – for precise areas of cropping, fallow, environmental, forestry and hedges
- Crop recording software – fertiliser and spray records, yield data
- Accounts and supplier invoices – energy use, materials
- Livestock recording software
- Waste and water records
- Machinery / infrastructure records
- Soil assessments
Farm Carbon Calculator
Popular for: Comprehensive calculations
Run by Farm Carbon Toolkit
Cost Free for farmers; subscription from £3,500/year for consultants
Number of users About 2,500 (new version only)
Overview
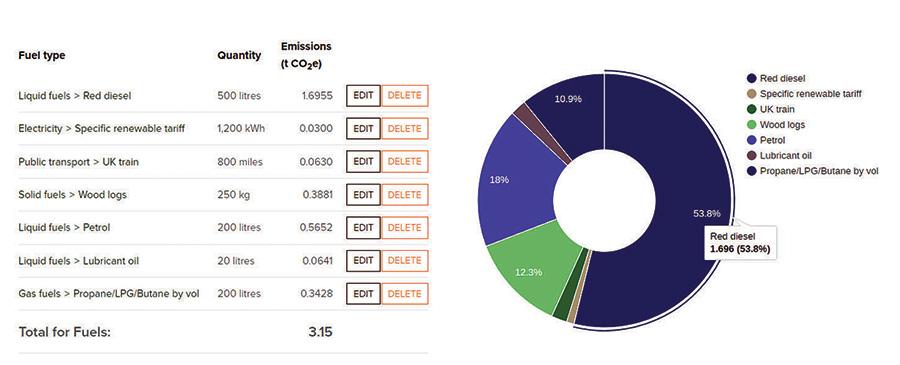
A new version of the calculator was launched in January 2020. It takes between 30 minutes and an hour to enter the data into the calculator, depending on the farm complexity, but finding that data can take quite a bit longer, as it is perhaps the most comprehensive for data entry.
A helpful spreadsheet highlights the information needed for the calculator, with tips on where to find it, but there are some details that might not be readily available on some farms.
It calculates the farm’s annual footprint, expressed as a carbon dioxide equivalent, although it also shows the breakdown between the three different greenhouse gases.
It uses the new methodology pioneered by the University of Oxford to better represent methane’s global warming potential.
It has an in-depth assessment of soil carbon sequestration, and the team is using its Soil Carbon Project with 90 farmers to validate the calculations, which are based on IPCC guidance.
This allows the tool to give an assessment of the carbon balance of the business.
An updated version is due early next year, which will address the limitations identified in terms of livestock productivity indicators and feed sources.
Pros
- Very thorough and interactive
- Helpful spreadsheet to collate information
- In-depth approach to carbon sequestration
- Able to see carbon balance for farm
- Easy to see how changes to your business affect emissions
- Accounts for renewable energies and capital items on farm
Cons
- Might not have all the relevant information available
- Relatively limited way of recording livestock diet and productivity
- Livestock numbers only an average across year
- How accurate is the carbon sequestration calculation?
The livestock farmer’s view
Richard Findlay: “Not as straightforward to fill in as the Cool Farm Tool, and it asks for some quirky things, such as soil bulk density, which I had to look up to find out what it was. I suspect a lot of farmers won’t have it to hand.
“It doesn’t go into the minutiae of livestock feed components, compared with Agrecalc, which might be important if you’re feeding lots of compounds or blends, for example. But it’s probably the best for accounting for carbon sequestration, and the extra data you enter helps give a better reflection of your carbon footprint.
“It’s quite interactive, helping to show you where you are compared with other farms and where you can improve.”
The arable farmer’s view
David Lord: “The Excel spreadsheet was useful to store your own information, but adds a layer of complexity. It doesn’t seem to take account of carbon sinking farming systems like cover cropping and no-tillage – only relying on soil organic matter changes, which won’t necessarily reflect immediate carbon storage.
“Any new constructions need taking into account, but I wasn’t sure of the relevance of existing concrete buildings and yards.
“The standout statistic was 45% of carbon emissions came from artificial fertiliser.”
Cool Farm Tool
Popular with First-timers and supply chains
Run by Cool Farm Alliance
Cost Free for farmers – up to five assessments allowed, but each can have unlimited changes. Membership opens up more options for unlimited footprints, sharing and aggregating data, but starts at £1,563/year for small businesses
Number of users 10,400, with the majority from arable sector
Overview
A favourite within supply chains, the carbon footprint calculator is part of a suite of tools under the Cool Farm Tool (CFT) banner, which also includes biodiversity, water and food waste/loss calculators.
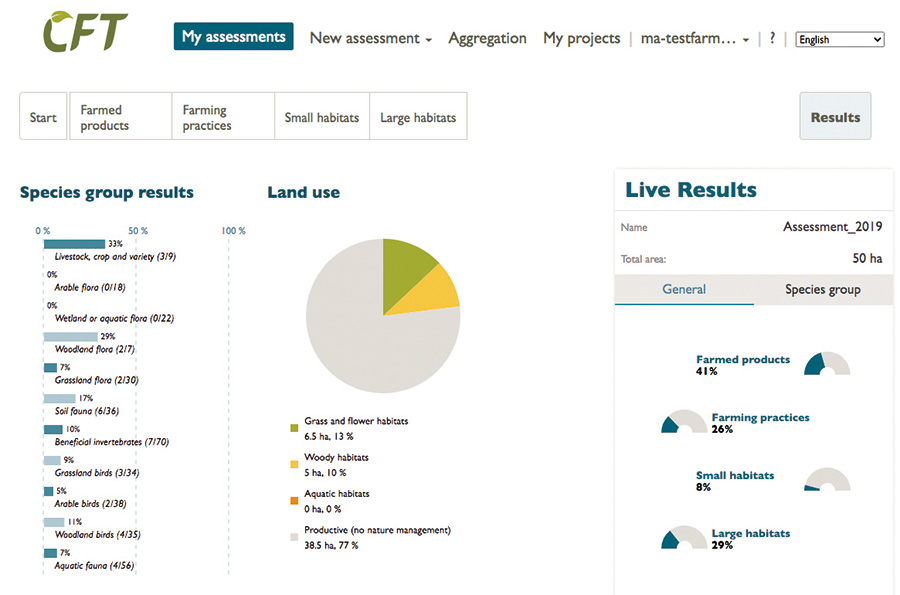
Cool Farm Tool computer screen shot
Originally developed by the Sustainable Food Lab, University of Aberdeen and Unilever, the website suggests a rough estimate of your carbon footprint of key products can be done in just 10-15 minutes.
Refining that estimate with farm records might take up to an hour. There are specific crop, dairy, beef and livestock modules within the tool.
Crops produced on farm are included as feed within the beef and dairy modules.
The carbon footprint is calculated by crop or livestock type, rather than as a whole farm, with emissions expressed as a carbon dioxide equivalent, but with a detailed breakdown by category and greenhouse gas.
This simplicity means it’s a great quick-start tool for farmers who want to understand where their emissions occur and take actions to reduce them. Aggregating data requires membership.
The alliance structure does, however, bring significant investment to drive development, such as working groups looking at how the tool can help monetise carbon markets, a soil working group investigating how to better reflect land use and rotation changes and their effect on sequestration, and the development of API connections with other tools.
A new version of the tool is due by March 2021.
Pros
- Good place to start, as relatively simple to get an initial assessment
- Easy to compare individual fields or crops or livestock types
- Opportunities to compare if part of a supply chain using CFT
- Investment from alliance members is driving development
- Globally applicable on all major crops and livestock
Cons
- Hard to get whole-farm assessment
- Aggregating data requires membership
- Limited machinery accountability in calculation (included in upcoming update)
- Limited productivity questions for livestock producers
- Limited carbon sequestration accounting for livestock producers
The livestock farmer’s view
Richard Findlay: “It was the quickest to complete and helps identify areas where you can improve. Part of the reason for it being simple to use is that there are modules specific to enterprise, so for a single-enterprise farm like ours, it’s easy to attribute everything to that enterprise.
“But it doesn’t give much detail, because you’re putting in the least amount of data. For example, it doesn’t take carbon sequestration into account, which for an all-grass farm has quite an effect on the result.
“If in the future it becomes compulsory to fill in a carbon footprint to access a particular scheme, such as say ELM, then this perhaps would be the one. But if you’re looking for more detail to help make improvements, then one of the others might be better.”
The arable farmer’s view
David Lord: “I really like this tool – it is tablet friendly and easy to use, showing results as you go. It takes account of tillage practices and cover cropping, which gave us a good positive to partially negate the use of artificial fertiliser.
“You can make it as simple as you like to give a guide, or more complex. It would be interesting to compare exact inputs with the other tools.”
Agricultural Resource Efficiency Calculator (Agrecalc)
Popular with Mixed farmers
Run by SAC Consulting
Cost Free version includes one updateable carbon audit, standard benchmarking and general KPIs. Pricing for the full version is under review, but previously cost £59/year for multiple audits, detailed benchmarking, specific KPIs and downloadable reports
Number of users 2,980 farms
Overview
Originally developed back in 2007, the Agricultural Resource Efficiency Calculator (commonly known as Agrecalc) was chosen as the tool to undertake compulsory carbon audits for the Scottish Beef Efficiency Scheme, and brings together a combination of the on-farm knowledge of SAC Consulting and the research and academic credentials of Scotland’s Rural College (SRUC).
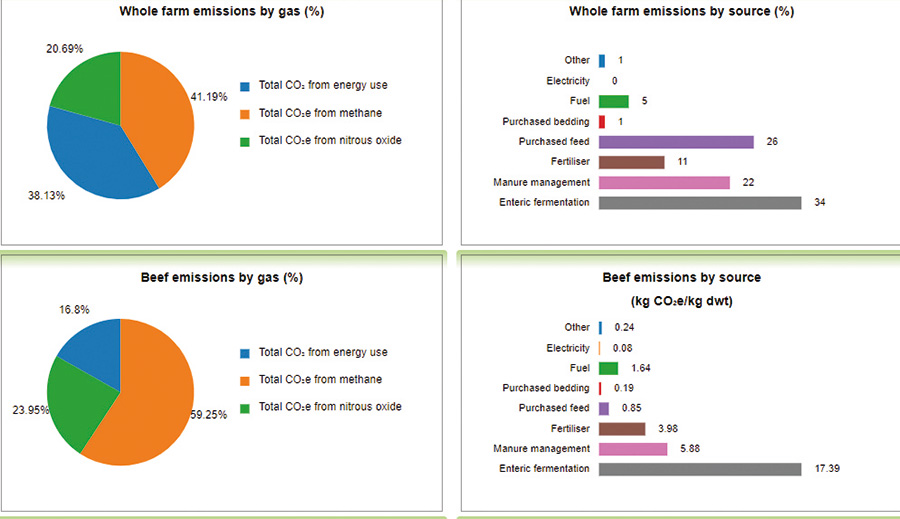
Agrecalc tool computer screen grab
Designed to capture whole-farm data, it can allocate resources between enterprises or by product, so can show results as a whole farm, or by enterprise or product type. It covers virtually all crops and livestock types.
The data required is comprehensive, but not impossible to find, which means the output is detailed and helps farmers understand where they are strong or which improvements might be needed.
Benchmarking against other farms within the system is included not just against carbon metrics, but also other key performance productivity indicators.
It handles livestock more comprehensively than the other non-specialist tools, including productivity metrics and more detailed emissions for different feed compositions.
An add-on has been developed to account for carbon sequestration based on the IPCC methodology published in 2019, although currently it is only available on request. A new version including this should be available in the autumn.
Pros
- Detailed assessment
- Able to calculate by farm, enterprise and product
- Includes key performance indicators for both carbon and productivity
- Benchmark against other farms
- Livestock productivity and feed components taken into account
Cons
- Less user-friendly and takes longer to fill in
- Support might be needed during data entry
- Some research needed for livestock diet components
- Carbon sequestration only for woodland in live tool; others only on request
- Livestock numbers only an average across the year
The livestock farmer’s view
Richard Findlay: “This one went into the most detail and was quite sophisticated. It wasn’t the easiest to use because of the details, and took the longest [of the three reviewed] to fill in. You need the farm accounts and I spent time working out the components of bought-in feed.
“But we felt that it gave the most accurate information because of the detail that was needed. Once completed, it splits out the three different greenhouse gases, which was very useful, and shows where you’re good and what your issues are in more detail.
“Of the three we tested, this perhaps gave the fairest result, but we also needed support when using it, so some work is perhaps needed to make it easier to complete, which hopefully the new version will take account of.”
The arable farmer’s view
David Lord: “Agrecalc is easier to use on a desktop computer than a tablet. It is detailed, and while there is no option to simplify, as with the Cool Farm Tool, data entry is quick and easy.
“It includes a breakdown of tillage practices for each crop, as well as residue management and the use of cover and companion crops – all very important in retaining and building carbon. It also differentiates between fertiliser types – urea, ammonium nitrate and compounds – and gives a report at the end which suggests mitigating actions.”
Explore more / Transition
During the series we follow our group of 16 Transition Farmers through the challenges and opportunities as they seek to improve their farm businesses.
Transition is an independent editorial initiative supported by our UK-wide network of partners, who have made it possible to bring you this series.
Visit the Transition content hub to find out more.