
How top dairy herds cut operating costs in 2016
 © Tim Scrivener
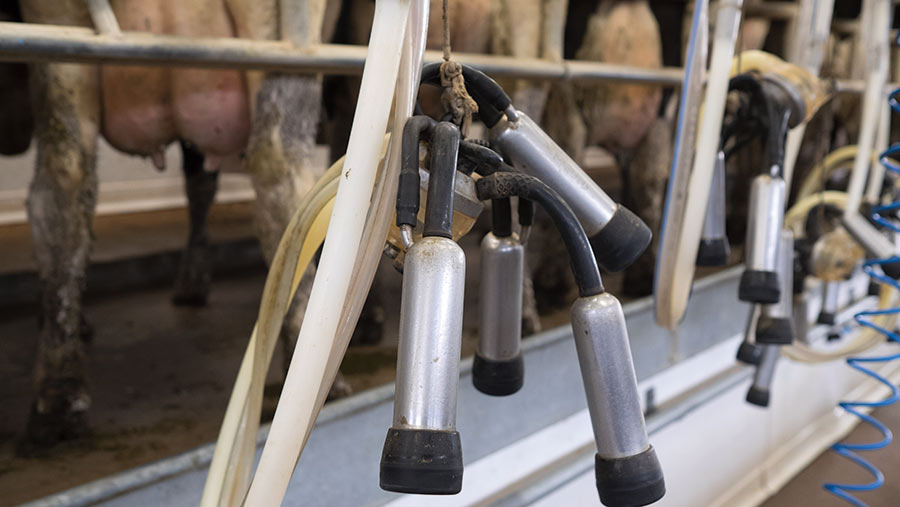
 The best-performing dairy business that made a profit in the low payout year of 2016 managed to reduce their operating expenses by 4p/litre on average, with feed costs being hammered the most, figures from LIC’s comparable farm profit (CFP) farm data shows.
LIC compared farm business data from 98 of its customers that made a profit in the year ending 31 December 2016.
See also: Uncertainty for dairy markets as GDT falls again
The figures show:
- There was less than a 2p/litre difference in milk price between the average and top 10% of producers, with the average actually receiving more at 24p/litre compared with 22.15p/litre.
- However, the difference in operating expenses amounted to 8.92p/litre between the average (24.82p/litre) and the top 10% (15.90p/litre).
- Delving into the costs in more detail, the figures show the biggest saving made by producers in the top 10% of performance was feed. On average, the top 10% cut feed costs by 45% compared with the average at just 20%.
- Aside from organic systems, operating expenses were similar across the range of systems (spring-calving, autumn-calving, once-a-day milking and split/year-round calving).
- Organic producers generated the most profit (CFP/ha) at £706/ha on average, due to the better milk prices they receive.
- This was closely followed by once-a-day milking at £456/ha on average.
- The worst were autumn (£366/ha) and spring calvers (£376/ha), due to the greater proportion of milk they produced in peak periods of low milk payout.
- However, the best (top 25%) across all systems made more than double this, on average.
Revealing the results at LIC’s Pasture to Profit conference in Birmingham last week (Thursday 9 November), LIC consultant Piers Badnell said farmers should focus on trying to get better at what they already do or assess if their system is fit for purpose.
He admitted the dataset was small and that comparing averages wasn’t as insightful as looking at ranges, but said conclusions every year showed a stark difference in cost of production between the best and average performers.
He said dairy farmers falling into the average category needed to question what barriers were preventing them from moving up the league table. He added mindset was key.
“Part of it is understanding and testing yourself. If you don’t test yourself, there’s no chance of pushing those boundaries.”
What is CFP and what is the target?
Comparable farm profit (CFP) is a standard measure used to compare the profitability and financial efficiency between dairy farms.
- It includes depreciation and unpaid labour costs (which in this comparison amounted to £30,000 based non 2,500 hours a year)
- But it excludes rent, finance expenses and BPS
Producers should aim to target a CFP of over 30% of total farm output.
| CFP breakdown of costs/ha | ||||||
|
Average |
Top quartile |
Top 10% |
||||
|
Income |
2016 |
2015 |
2016 |
2015 |
2016 |
2015 |
|
Milk |
2,319 |
2,662 |
3,139 |
3,443 |
3,191 |
3,904 |
|
Milk price |
24.16 |
26.35 |
24.22 |
24.03 |
25.93 |
24.10 |
|
Total |
2,677 |
3,158 |
3,467 |
4,055 |
3,575 |
4,682 |
|
Expenses |
||||||
|
Total feed |
528 |
663 |
673 |
884 |
622 |
1,133 |
|
Total fert |
138 |
161 |
153 |
177 |
180 |
202 |
|
Total P&M |
353 |
386 |
422 |
415 |
396 |
453 |
|
Total labour |
553 |
611 |
605 |
625 |
565 |
696 |
|
Total variable |
963 |
1,1557 |
1,214 |
1,873 |
1,182 |
2,233 |
|
Total fixed |
1,229 |
979 |
1,362 |
981 |
1,051 |
1,239 |
|
CFP/ha |
498 |
622 |
925 |
1,205 |
1,159 |
1,398 |