Best ways to use dairy key performance indicators
 © Adobe Stock
 Looking at the milk tank ticket has always been the dairy farmer’s reliable key performance indicator (KPI).
But tank-watching is not the best way to make business decisions, given that the amount of milk is the consequence of past decisions.
Technology recording thousands of data points and software programs analysing them can lead to information overload and confusion about the best KPIs to follow, how often they need to be reviewed, and who with.
See also: Dairy financial KPIs: What they mean and when to use them
KPIs are designed to help understand, at a glance, how the farm is performing, both physically and financially.
They allow for comparison between previous trading years, or with other dairy farms. And they reveal areas for improvement, as well as highlight successes.
AHDB set up its physical and financial KPIs for two systems based on calving pattern (see “Key performance indicators”) after consultation with the dairy industry.
While rapidly rising costs have pushed the figures out of date for realistic comparison, they remain valid business indicators, says Andersons business consultant Tony Evans.
Setting goals
He explains that a KPI is not just for comparison, it also needs to support a farm business plan.
“You should always be clear about what your goal is, whether it is milk in the tank or profitability. This means setting targets and milestones along the way – all written down,” he says.
KPIs are used to track progress. Whether technical or financial, they must relate to profitability:
“That’s what pays the bills. The ultimate KPI is return on investment. Some people are borrowing money at 7-8% interest, and the idea is that you use this money to make money. Every £1 you put in must generate a return,” he stresses.
Because farmers do not like to declare their profits publicly, Tony says the closest option for financial comparison is to use a comparable farm profit (CFP) or cost of production (COP).
The danger with focusing on a technical KPI too much is when no thought is given to the cost of serving it, he adds.
“Yield from forage, for instance, is a derivative of concentrate use, but if you feed the best cake going, one that is more expensive than another brand, is the business still going to make money?”
Technical KPIs are important to help understand a system’s productivity and monitor items such as volatile feed prices, or milk produced from grazed grass.
“This allows you to compare with previous years, especially [items such as] grassland where you can see the outcome of a growing season,” he explains.
Annual review
Reviewing KPIs is an annual job to be done at the same time every year. Tony says this ensures the business will be in the same position – unless there has been major change.
If they reveal a problem, he advises taking immediate action. “Don’t put your head in the sand. Make a plan to deal with the deficit and communicate this to everybody – business partners and professionals.”
Even when performance is good, with money in the bank, it is important to take action. Use a cash surplus to drop debt, take private drawings, or invest it to earn interest, he says: “Otherwise you will be tempted to spend it [unwisely].”
Focus carefully
LIC business consultant Sean Chubb says that even when results are good, there is always room for improvement.
But, he points out it is important to look at the best return for time invested. “Don’t put in more focus for a small achievement. Look at your whole farm for better wins,” he says.
“Some people focus on one area and another slips backward, so ensure that everything else maintains performance. You don’t want to save £1 here, to lose £1.20 elsewhere.”
Sean uses a short checklist of KPIs to quickly assess a farm’s strengths and weaknesses. Targets for heifers, fertility, and grazing can identify issues, which he can then examine in detail with the business owner.
He often finds that asking for heifer growth targets and the percentage of heifers retained into second lactation reveals a lack of data.
“Not enough people know the latter or even where to get the information. Also linking to this is when people rear heifers to sell, yet don’t know their rearing costs, so can’t say if they actually make a profit.”

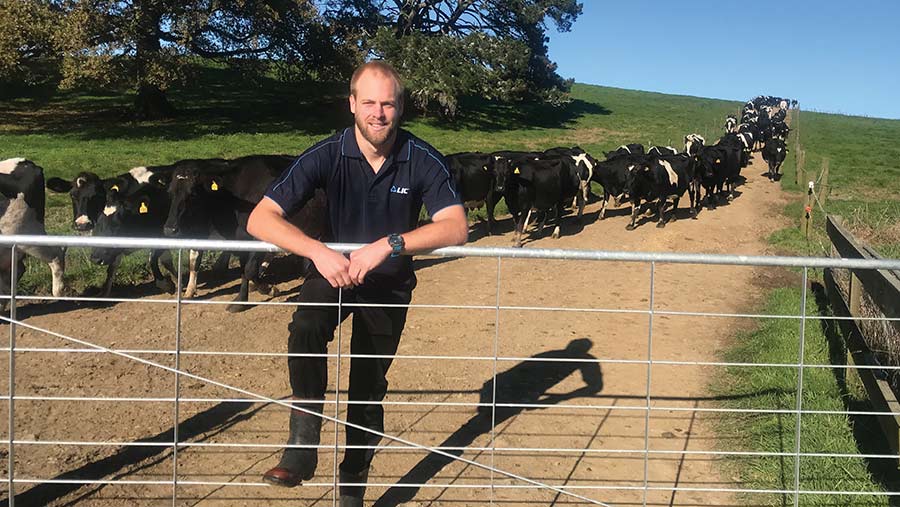
Sean Chubb © LIC
Accuracy
To get a handle on fertility in a block-calving herd, Sean looks at the six-week in-calf rate.
This is a better measure than the six-week calved figure, which can be manipulated by the number of calving heifers, or by culling late-calving cows.
Another useful KPI is the percentage of grazed grass in the diet. Again, many farms do not know this figure, says Sean.
“I ask for their milk from forage figure and couple this with their stocking rate. It’s not the most accurate KPI, but it gives some guidance.”
He agrees that action is needed when KPIs reveal a problem, and says to get help if unsure where to start.
However, even though some KPIs are measured annually, he says others are seasonal or measured daily, and it is important to review KPIs monthly or bi-monthly.
“If you wait until the end of the year, you have lost the whole year to do anything about it. Monitor and make changes along the way,” he says.
Key performance indicators
All-year round calving
- Pregnancy rate (%)
- Age at first calving (months)
- Total purchased feed costs (p/litre)
- Milk from forage (litres and kg milk solids)
- Average daily lifetime yield (litres)
- Overheads excluding rent and finance (p/litre)
Block calving
- Cows and heifers calved within the first 6 weeks (%)
- Herd replacement rate (%)
- Milk solids output (kg/ha)
- Milk from forage (litres and kg milk solids)
- Overheads excluding rent and finance (p/litre)
Financial
- Full economic net margin (p/litre)
- Return on tenants capital (%)
- Full economic costs of production (p/litre)
Source: AHDB
