
Farm energy case study: Small-scale AD Norfolk
One of the best ways to assess whether a renewable energy investment would work on your farm is to talk to others who have been through the process.
Paul Spackman quizzed five farmers who have been generating renewable energy for at least a year to hear their experiences and get their tips for others considering entering what is still a relatively new sector.
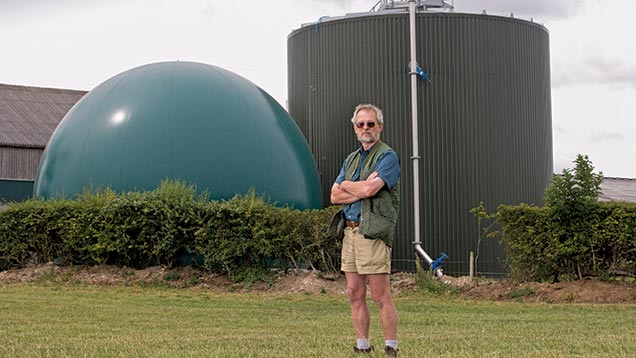
Stephen Temple has a small-scale anaerobic digester at Copys Green Farm in Norfolk.
Project overview
A combined heat and power (170kW electrical, 198kW thermal) anaerobic digester at Copys Green Farm, Wighton, Norfolk. The digester was designed by Greenfinch (subsequently Biogen Greenfinch, then Biogen) and is fed entirely from on-farm resources (slurry, manure and silage/energy crops).
Ownership
Owned outright by JF Temple and Son, financed from company and family funds.
Timescale
The initial decision to build an AD plant was taken in March 2008, with planning approval given in May that year. The plant began “consistent” gas production in December 2009. The first 140kW combined heat and power unit (CHP) was commissioned in June 2010, but was replaced that winter with a 170kW IET unit, commissioned in February 2011.
Performance
Mr Temple says some elements of the project have performed better than expected, while others were far worse. Technical problems with the original CHP unit (mainly the ignition system and electrical connections) meant it had to be replaced, while digester maintenance costs were also higher than expected until some modifications were made. He is much happier with the replacement CHP and says gas production and returns from electrical/heat generation (see table right) are now better than he expected.
Running costs and net return
Annual returns and feedstock use are summarised in the table left. All feedstocks are produced on the farm.
Payback
Originally projected to be eight years, now more than nine years.
Most difficult part
Mr Temple says that before commissioning, electrical connection and metering were the most difficult hurdles. “Initially EDF, our distribution network operator [DNO] at the time, [it is now UK Power Networks] were very slow with the quotation, and required information I could not provide.
“Then the electrical connection required a new meter for import and export. I could not employ a meter provider until I had an electricity buyer, and could not get a contract with an electricity buyer until I had a meter provider.
“Thanks to help from our buyer, Tradelink Solutions, we eventually got that sorted out. I understand it is all a bit easier now as they are more used to the process.”
Once the system was commissioned, getting the original CHP to work to specification was “impossible”, he says. Retrospective changes in Environment Agency permitting requirements after commissioning were also problematic.
There were some technical issues with getting the feeding equipment to handle flints and rogue bits of metal, and the separator to deal with limescale, but all these problems were rectified using the farm’s own resources, he says.
Easier than expected
Operating the second CHP.
Most useful advice
“We did not get any useful advice.”
Change anything?
“I would have started off from where we are now with many detail changes, but using the same general principles and system.”
Advice to others
“Go to see other systems similar to what you are proposing, and talk to the people who maintain it. When buying equipment, make sure quotes include spare parts costs.”
Rating: 7/10
“The main stresses were sorting out the feeding system and the original CHP.
“Once sorted, benefits were well worthwhile, with more electrical income streams than anticipated, RHI income for heat used, and good digestate value.
“It’s taking more of my time than anticipated, but providing me with an interesting engineering challenge.”
|
Project cost |
|
|
Item |
Cost (£) |
|
Machinery |
131,000 |
|
CHP |
116,000 |
|
Sludge pipework |
103,000 |
|
Groundworks |
96,000 |
|
Digester tank |
85,000 |
|
Silage bunker |
81,000 |
|
Management/design |
73,000 |
|
Controls and instruments |
46,000 |
|
Gas equipment |
38,000 |
|
Electrical installation |
33,000 |
|
Hot water system |
26,000 |
|
Miscellaneous |
19,000 |
|
Digestate lagoon |
17,000 |
|
Total |
864,000 |
|
Production and returns |
||||
|
2010 |
2011 |
2012 |
2013 |
|
|
Annual useful heat (MWh) |
– |
– |
63 |
174 |
|
Electricity generated (GWh) |
0.17 |
1.03 |
1.25 |
1.17 |
|
Electricity exported (MWh) |
110 |
773 |
958 |
884 |
|
Electricity bought (MWh) |
69 |
27.6 |
4.2 |
1.7 |
|
Generated and used (MWh) |
60 |
257 |
292 |
286 |
|
Digester electricity (MWh) |
96 |
119 |
109 |
122 |
|
Digester heat (MWh) |
– |
– |
226 |
293 |
|
Spares and repairs (£) |
– |
41,569 |
32,446 |
39,316 |
|
Feed-in Tariffs (£) |
19,800 |
115,300 |
154,000 |
152,000 |
|
LECs* (£) |
728 |
4,149 |
5,600 |
5,500 |
|
REGOs* (£) |
– |
176 |
312 |
292 |
|
Electricity sold (£) |
3,175 |
34,045 |
43,223 |
43,000 |
|
GDUos* (£) |
– |
– |
5,611 |
6,500 |
|
Triads* (£) |
– |
– |
2,532 |
2,200 |
|
Renewable Heat Incentive (£) |
– |
– |
9,259 |
14,600 |
|
Value of electricity used (£) |
-3,600 |
13,800 |
18,300 |
16,400 |
|
Slurry (tonnes) |
2,015 |
1,836 |
1,633 |
1,070 |
|
Maize (tonnes) |
637 |
1,877 |
2,203 |
2,100 |
|
Beet (tonnes) |
56 |
320 |
449 |
850 |
|
Whey (tonnes) |
– |
– |
204 |
236 |
|
Farmyard manure (tonnes) |
47 |
176 |
107 |
220 |
|
Wholecrop (tonnes) |
– |
48 |
109 |
120 |
|
Value of NPK & S (£) |
– |
4,026 |
3,832 |
14,023 |
|
*Note: LECs: Levy exemption certificates Regos: Renewable energy guarantees of origin GDUoS: Generator distribution use of system Triads: Three half-hour periods during winter with the highest national demand for electricity, separated by 10 clear days. |
||||