Why no-till is profitable despite having a yield penalty
 © Tim Scrivener
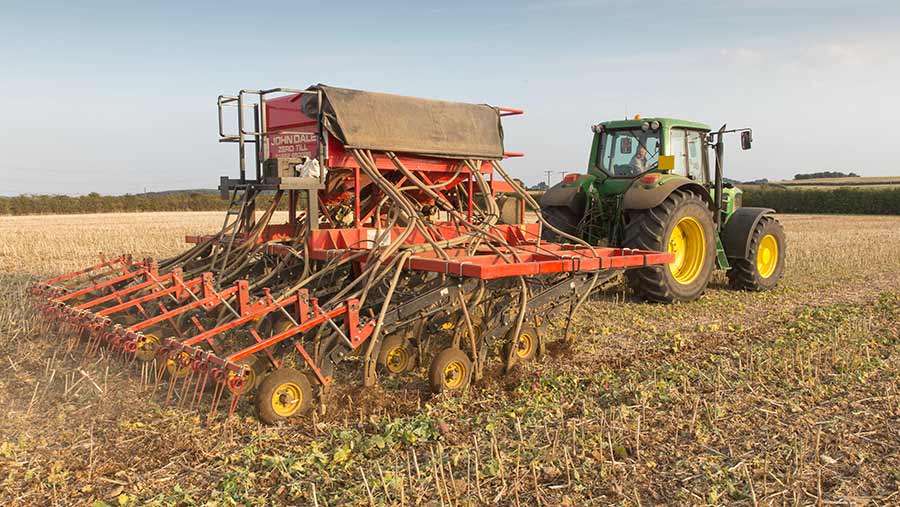
 As machinery costs are the main driver of arable profit, no-till farms can afford to produce 1t/ha less wheat than their more conventional counterparts.
Speaking at the Groundswell event in June, accountant Gary Markham of Land Family Business said that the 22% lower labour and machinery costs with no-till farming gave more leeway on wheat yields, because of the the significant saving in working capital.
His message to no-till farmers is, therefore, not to worry about losing a bit of yield, as margins don’t suffer even if output is lower.
See also: Why wheat is £10/t cheaper to produce with no-till approach
“It’s a different mindset – with these systems we are talking about economic yield being king, rather than yield being king.”
Investment in machinery
As a result, one of the key performance indicators that he has identified for no-till farms is the investment in machinery per tonne of production.
In 2018, the no-till benchmarking group had an investment figure of £97.60/t, compared with £110.87/t for other farms.
“This should be the standard benchmark for no-till. It’s a different approach and a new way of thinking, but it’s the first figure to look at when you make the move to a less intensive system.”
The current level of investment in machinery is damaging the viability of arable farms, warned Mr Markham, as it has led to the need to acquire more land to spread the costs and a drive to maximise yields – both of which come at a cost.
“It’s a treadmill and not sustainable. But making the move to a very different system is a leap of faith, which is one of the reasons why this no-till benchmarking exercise was developed.”
Fixed costs
The 2018 results showed that labour and machinery costs were £350/ha on no-till farms, compared with £449/ha on farms with more traditional cultivation regimes.
In terms of working capital (or machinery value/ha), there was a saving of £186/ha with no-till. When added to the £74/ha saving made with variable costs, no-till systems represented a total saving of £260/ha.
“If you look at that level of saving across a 500ha farm, it represents £130,000.”
However, lower yields continued to be a feature of no-till systems, as did greater variation.
“We are still seeing big differences in performance across the farms in the benchmarking group,” he said.
“That can be partly explained by their greater use of spring cropping – some of which really struggled in the dry conditions last year.”
Gross margins varied widely amongst the no-till farmers, from £196/ha to £657/ha. Profit ranged from -£80/ha to £200/ha.
“There was no account taken for the increase in soil health or other environmental benefits, both of which might have a monetary value in the future.”
No-till benchmarking
- Capital value of machinery – £186/ha less
- Variable costs – £74/ha less
- Wheat yields – 14% lower
- Machinery capital – £13/t less
- Working capital – £260/ha less (£130,000 less on 500ha farm)
Yields are lower with no-till compared with other establishment systems |
||
| Average no-till | Average others | |
| Yields (t/ha) | ||
| Winter wheat | 7.28 | 8.45 |
| Oilseed rape | 3.47 | 2.89 |
| Winter barley | 6.18 | 6.28 |
| 760 | 1,030 | |
| Variable costs (£/ha) | 364 | 438 |
| Gross margin (£/ha) | ||
| Source: Land Family Business | ||
There is considerable variation in the performance of no-till farms |
||
| Lowest | Highest | |
| Yields (t/ha) | ||
| Winter wheat | 5.45 | 9.10 |
| Oilseed rape | 4.27 | |
| Winter barley | 4.25 | 7.28 |
| Variable costs (£/ha) | 450 | |
| Gross margin (£/ha) | 196 | 657 |
| Source: Land Family Business | ||