How two farmers slashed costs with reduced tillage and sharing kit
Gaining a clear understanding of machinery and labour costs is the first step to surviving periods of low grain prices.
In the first of this two-part BASF/Crops Costs Under Scrutiny initiative, Richard Allison looks at how two East Midlands farmers trimmed their costs.
A key debate raging on many arable farms across the UK is which costs to cut, because getting it wrong can have the opposite effect by denting yields.

© Tim Scrivener
With feed wheat around £100/t, growers are being forced to make cuts to survive after several seasons of poor margins have used up what cash reserves they had. Banks are also taking a tougher line.
See also: How to get your arable machinery costs under control
On one side is the argument to trim back variable costs, such as sprays and fertiliser, while others argue that fixed costs offer the best route, making changes to machinery renewal plans and opting for lower cost cultivations.
But before growers can identify where to cut, they first need to understand their own costs. There could be a simple reason for their higher spend, such as a severe blackgrass infestation.
Know your figures
North Lincolnshire farmer and independent consultant Pat Thornton recalls when the AHDB carried out a survey prior to launching its Monitor Farms initiative, asking farmers what their costs of production were on a per tonne basis.
“Most (80%) declined to give an answer. However, of the 20% that did, only a minority had the actual numbers with the rest giving either a guesstimate or said that they had done the calculations but cannot remember the correct numbers.”
Once you know your baseline cost, you can then see the impact of price volatility on your business. For example, if it costs £120/t to grow wheat, there will be more years of pain than if you are closer to £100/t.
Weather
While price volatility is a given, both Mr Thornton and Leadenham-based grower Andrew Ward see rainfall as the main source of volatility affecting their bank balances.
The average rainfall on Mr Thornton’s farm near Doncaster is 630mm/year, but it has ranged from 400mm to 800mm over the last 10 years.
“We looked at commodity prices and saw little correlation with costs. However, we did see a greater correlation between rainfall and costs,” he says.
In fact, the effect of wet winter in 2012 is still being felt in the form of higher fixed costs because of the ongoing remedial action to damaged soils, which still haven’t fully recovered.
Both agree that benchmarking with similar businesses is a valuable tool for identifying any above average costs. This can be achieved by joining an AHDB Monitor farm group, a Niab club or simply using the Farm Business Survey’s online tool, which compares your figures with the average.
“Joining a benchmarking club does work, but you all need to be open to sharing figures and having them questioned,” says Mr Ward, who is helping to run a local group.
Fixed costs are key
Coming back to the variable versus fixed cost debate, Mr Thornton points to the Farm Business Survey results for 2015.
Looking at the difference between the top and bottom 25% performing arable businesses, there is only a £4/ha difference in variable costs. For fixed costs, the difference is £230/ha and, therefore, he believes this is where the focus should be.
BASF agronomy manager Ruth Stanley agrees that fixed costs offer the greatest cost-cutting scope, with data from the 2014 Oxford Farming Conference report showing they accounted for a greater proportion of total costs on poorer performing farms.
“Fixed costs for the bottom 25% accounted for 57% of total costs, while for the top 25% of businesses, it was 46% of the total,” she says.
However, care is needed in ensuring everything is included to give a full picture of costs, as there is no standardised approach to calculating fixed costs.
For example, machinery costs in AHDB’s Crop Bench comprises three elements – depreciation, fuel and machinery.
But Mr Ward believes there are other important components, including maintenance and wearing parts, fuel and the finance cost of capital outlay (see panel).
Ultimately, Mr Thornton says the important thing is farmers make a start with benchmarking and begin to understand their costs before getting bogged down in the detail.
Even a simplified approach will highlight if there are too many cultivation passes – for example, are you carrying out recreational cultivations? Also, it will help growers assess the benefit of keeping equipment longer on depreciation costs.
Cereals Farms Performance 2014-15
|
|
Bottom 25% |
Top 25% |
Difference |
|
Agricultural productivity (£output/£input) |
0.74 |
1.18 |
0.44 |
|
Financial performance (£/ha) |
|
|
|
|
Total farm output |
878 |
1,089 |
211 |
|
Variable costs |
422 |
388 |
34 |
|
Gross margin |
456 |
701 |
245 |
|
Fixed costs |
760 |
530 |
230 |
|
Total costs |
1,182 |
918 |
264 |
|
Farm Business Income |
-291 |
175 |
466 |
Source: Farm Business Survey
This series is a Crops/BASF joint initiative aimed at helping farmers gain a better understanding of their machinery and labour costs and thereby identify ways to make savings in their fixed costs. The first part was based on a round table discussion with Pat Thornton, Andrew Ward and Ruth Stanley.
 Case study: Pat Thornton, Low Melwood Farm, Lincolnshire
One way to reduce machinery costs is by collaborating with other farmers, and this has been his approach taken by Pat Thornton.
He farms 140ha of combinable crops including winter wheat, oilseed rape plus an increased area of spring cropping to comply with the three-crop rule.
Mr Thornton took the step of entering a flexible contract agreement with his neighbour, who now carries out all drilling and harvest.
“While it feels like you are losing control, it does work if you have a good relationship with the other partner.
“We sometimes hire a ‘man and tractor’ to do cultivations using our kit and we also do elements of his post-harvest work at pinch points, such as when he needs to harvest elsewhere.
“This has given us both scale and access to machines and technology that is usually beyond the economies of our farm size.”
Farm facts – Low Melwood Farm, Epworth
- 140ha of cropping including 40ha wheat, 40ha oilseed rape and 20ha spring wheat, 40ha spring barley
- Labour: Pat plus his father
- Key cost-cutting approaches
- Sharing machinery to reduce depreciation and labour
He adds that not only has it brought savings by cutting depreciation, but also means machinery and labour costs are much more transparent and easier to budget for.
Case study: Andrew Ward, Leadenham, Lincolnshire
Getting on top of blackgrass and making drastic changes to establishment system is how Andrew Ward cut his fixed costs over the past three years, enabling him to grow wheat for less than £100/t.
And his no-nonsense approach to blackgrass has seen a move to spring cropping and hand rouging infestations.
He also hasn’t been afraid to spray off severely infested crops to prevent blackgrass seed return, and in his first year, 73ha of wheat was sprayed off.
Cultivation wise, he has gone against mainstream thinking by not using the plough. Ploughing is put forward as the answer to the weed, but he believes it has no role on his farm.
“There isn’t a plough out there that can do a proper job, fully inverting soil on heavy land.

“We did try ploughing an area before barley a couple of years ago and it resulted in £120/ha extra cost, as we had to cultivate more to create a good seed-bed. It also yielded 0.7t/ha less than the area that was not ploughed.”
He explains that it came to a head in 2012 when after 2010, yields were heading downwards and costs were rising, which was unsustainable.
Three years on and yields have recovered to pre-2009 levels and costs are back under control, after making significant changes to the business in 2012.
Tackling blackgrass
One change was to introduce spring cropping into the rotation as a means of tackling blackgrass, which involved categorising fields according to infestation.
Mr Ward has three different categories, category A fields have no blackgrass and is the lighter heath land with a rotation of sugar beet, spring barley, oilseed rape and then wheat.
Three categories of land
- A This is the area with no blackgrass and tends to be the lighter heath land on the ridge near last year’s Cereals event site
- B The second is where there is some blackgrass, which is manageable, on heavier soils
- C The final category are fields with a severe blackgrass, and these won’t see a winter cereal for the foreseeable future
Category B fields have medium soils and some blackgrass. Sugar beet is also grown on these fields, but he is increasingly seeing blackgrass in sugar beet.
Farm facts – Glebe Farm, Leadenham
- 660ha of cropping including 156ha wheat, 217ha high oleic, low linolenic oilseed rape, 42ha sugar beet, 220ha spring barley and rest grass margins
- Machinery: Case Quadtrac, Case Puma CVX 225, JCB Fasctrac, New Holland CR9090 combine, Houseman 4,000litre SP sprayer, 8m Simba Freeflow, 4.5m Simba Solo, 5.5m Cultipress DD rings, 5m Simba Elita 500 (11 legs)
- Labour: 1 full time + 1 part time (2 harvest casuals)
- Key cost-cutting approaches
- Simplifying cultivations with fewer passes and less intensive
- Tackling blackgrass to improve yields and lower herbicide costs
“Depending on how well we manage to control it, it will be followed by either wheat or spring barley, then oilseed rape and wheat/spring barley.”
For the severe blackgrass fields (category C), there are no winter cereals, the foreseeable future being oilseed rape followed by two years of spring barley.
His aim is to go to harvest with no blackgrass seed return and he is investing in labour to hand rouge fields, which cost £36/acre last year. “We no longer use Atlantis, as we get more control from this approach.”
If it is too bad to pull blackgrass, he will spray off with glyphosate. “Three years ago when we started, we took out 180 acres of wheat. This year, it was down to an area equivalent to a tennis court.”
Cultivations
Another change was to simplify cultivations by adopting reduced tillage.
Many say you can’t establish spring crops heavy land, but Mr Ward disagrees. “That is because most people cultivate the ground too late in the autumn.”
His current approach for spring barley and wheat is to follow the combine with a Simba Solo. “Working land in August/September means you can drill next spring on heavy land.
“Soil has a memory. If you work it when wet, it will stay wet in spring,” he says.
Other than a glyphosate application, the next main cultivation is the Simba Freeflow drill and then rolls.
His previous approach was to plough and press, disc and press and then power harrow before drilling, which equated to an average 186mins/ha and cost £144/ha. By eliminating several passes, the new approach takes one-third the time and costs £83/ha.
“The 8m Simba Freeflow can cover 200 acres in a day,” he says.
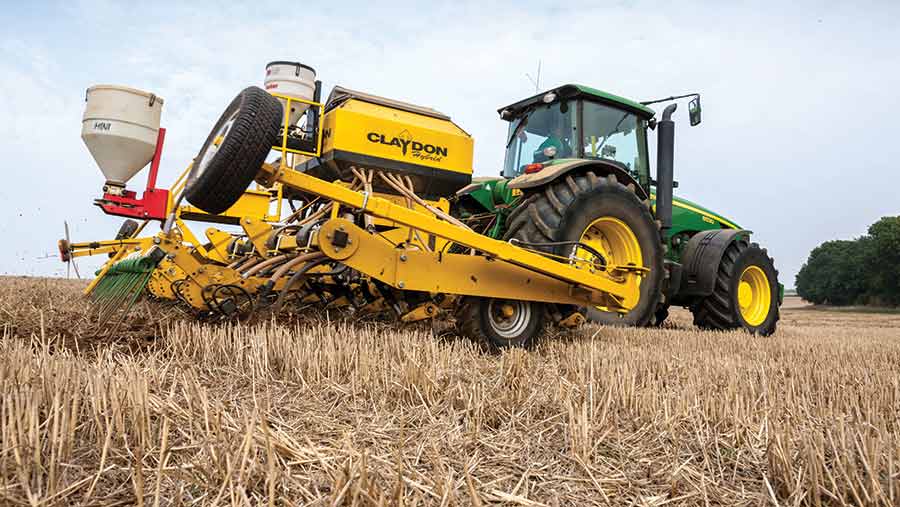
Oilseed rape establishment has also been simplified and he is using a home-built drill. He designed it together with Philip Wright, with the aim of minimising soil disturbance to avoid blackgrass germination. Again this has cut the time taken, from 152 minutes to 41 minutes with a £40/ha saving.
“The massive time saving means we can go out and do work [contracting] for other people, but not at any price.”
Mr Ward is a real fan of using a Cultipress with no tines instead of Cambridge rolls on oilseed rape. “It gives reduced surface loading while firming at depth.”
This has allowed him to cut seed rates to 25/sq m on light land and 30-45 on his heavier land.
“We are getting 90-95% establishment because of the press, allowing us to reduce seed costs.”
Andrew Ward’s machinery cost calculations
Do you know how much your fuel costs rise in a wet harvest and are you accounting for the extra cost of cultivating heavier soils?
If not, you could be losing out by failing to fully account for your machinery costs.
Fuel use records are a key part of Andrew Ward’s approach to calculating his machinery running costs. He also includes depreciation, labour, spares and repairs, finance interest and insurance.
“It’s important to keep fuel records, as it can highlight any key changes.” For example, he saw a 280% difference in fuel costs for his New Holland 9080 combine, depending on the year.
In the dry summer of 2011, it used 3,734 litres to cut 423ha of cereals. But in the following wet summer, it was over 9,000 litres for a smaller area. The work rate in the wet year was 2.67ha/hr compared with 4.58ha/hr the year before.
“A lot of contractors would have been operating at a loss that year,” he believes.
Staff have also bought into fuel monitoring despite the extra time to keep records, as they look to better their figures from the previous year, he says.
He has also calculated the difference in cost for soil types. For example, the 4.5m Simba Solo pulled by the Quadtrac costs £6/ha more on the heavier land.
“This has a dramatic effect on your total costs and needs to be included in your growing cost calculation,” he says.
What about variable costs?
Pushing for yield is the key to diluting costs/t and the risk of trimming variable inputs is that it will hit yields.
That’s why BASF East Midlands agronomy manager and Leicestershire grower Ruth Stanley believes it is crucial to get the most out of fungicide inputs.
“There are two ways to reduce costs, either cut costs without impacting yield or increase yields at minimal cost,” she says.
She points to 17 years of Niab Tag research by Clare Leaman, showing a yield response to fungicides across all varieties, averaging 2.2t/ha. “They saw a response to all varieties and in low and high disease pressure years.”
Looking to 2016, the problem is forecasting risk. “Can you guarantee fungicides are sprayed at the right time given the changeable weather and windy days?”
This is why it still pays to go strong early and keep on top of disease. “It is cheaper and easier to protect crop rather than cure,” she says.
